Strava Fitness & Freshness chart
Strava Fitness and Freshness considers your heart rate based Suffer Score and power based Training Load to track your levels of fitness, fatigue and form over time.
Fitness & Freshness Requirements
The Fitness & Freshness chart uses Training Load and/or Suffer Score to quantify your daily training. Training Load is calculated using power or heart rate data, so a power meter or heart rate monitor is required.
If you’ve just started using a power meter or heart rate monitor, it will take 6-8 weeks for your Fitness Score to be accurate.
Fitness
While fitness is a complicated concept, it can be simplified to an accumulation of training. The Fitness Score is calculated using Training Load and/or Suffer Score to measure your daily training, and an impulse-response model to quantify its effect over time. This will intuitively capture the development of fitness from training, as well as the loss of fitness during a break.
Fatigue
Conceptually, fatigue is easy to understand; it’s that tired feeling which limits your performance. We model it the same way as fitness, but on a shorter time scale. You’ll notice the score go up quickly after a couple hard days, but also go down quickly as you take a few days off.
Form
Being in form, or “peaking,” happens when one is very fit but not fatigued. Here we model this as the difference between your Fitness Score and your Fatigue Score.
So What Does it Mean?
While this type of fitness and freshness chart is popular among endurance athletes it can be difficult to understand at first. In general the overall numbers aren’t as important as general trends. If possible, it’s best to compare where you are now to times in the past when you were fit. This can help you determine your current fitness and how to get even better.
How It’s Calculated
Our method for calculating Fitness, Fatigue, and Form is based off an impulse-response model first developed by Dr. Eric W. Banister in 1975. It was later applied to cycling by Dr. Andy Coggan.
The concepts apply to any measure of training stress. For example, the first models used average heart rate and time. We use Training Load and Suffer Score, computed using data collected from a power meter and heart rate monitor, respectively.
See: Strava - Fitness & Freshness
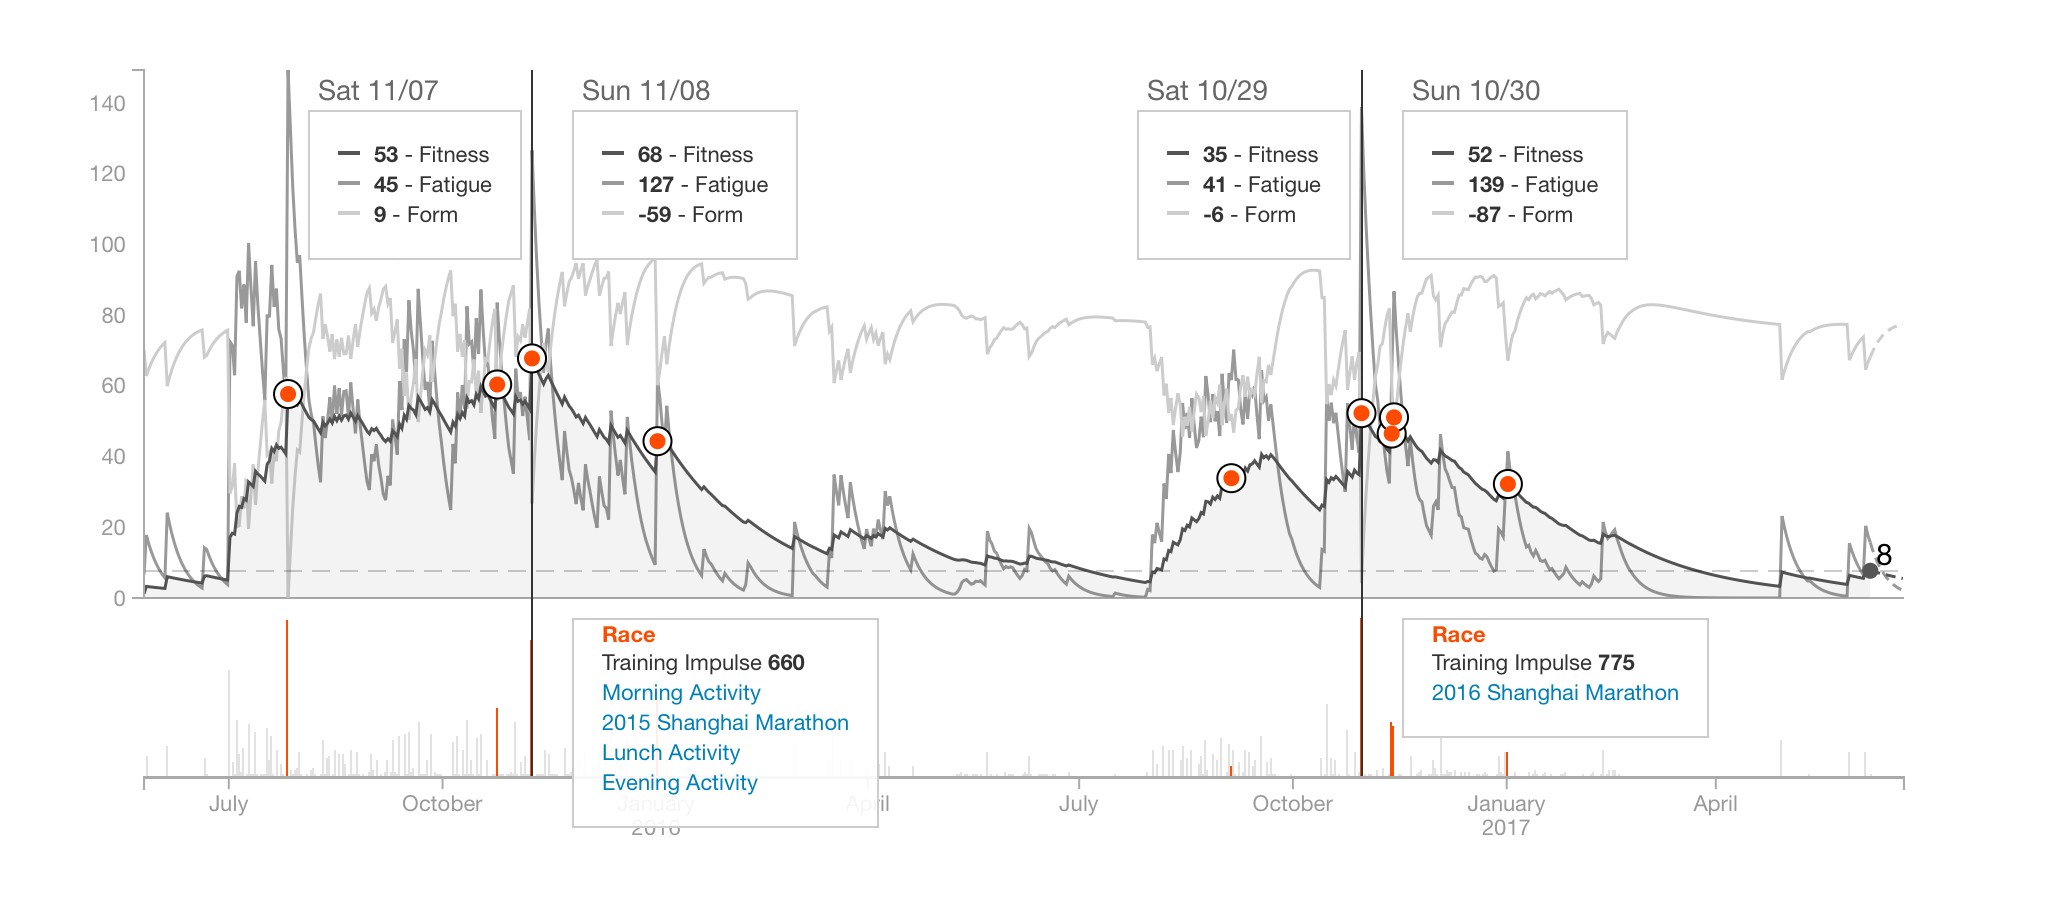
e.g. 下图是试用Strava Premium 得以看到的一张基于心率计算出来的我的fitness 趋势图。图中橙色点为race 。马拉松个人纪录的那个橙色点的确是所有race 里fitness 最高、赛前fatigue 较低的。图中fitness 曲线的上升下降也符合主观感受。有趣的分析。不过暂时还是没有付费使用Strava 的计划…